

- SFNet Announces FY27 Leadership Appointments
- The Signal in the Survey: ABL Credit Quality as an Early Warning of Systemic Stress
- Factoring Volume Rises as Industry Outlook Strengthens, SFNet Mid-Year Survey Finds
- Frozen Food's Middle Market Is an Underserved Credit Opportunity
- Factoring Finds Its Footing: Volume, Confidence and Working-Capital Demand Rise in H1 2026
The Signal in the Survey: ABL Credit Quality as an Early Warning of Systemic Stress
October 5, 2026
By Hao Ding, PhD

New academic research finds that the numbers SFNet members report every quarter carry information about system-wide financial stress up to two years before it arrives, and that they add predictive power the traded market does not supply. The survey’s nonaccrual rate has just posted its highest reading since 2011.
New academic research finds that the numbers SFNet members report every quarter carry information about system-wide financial stress up to two years before it arrives, and that they add predictive power the traded market does not supply. The survey’s non-accrual rate has just posted its highest reading since 2011.
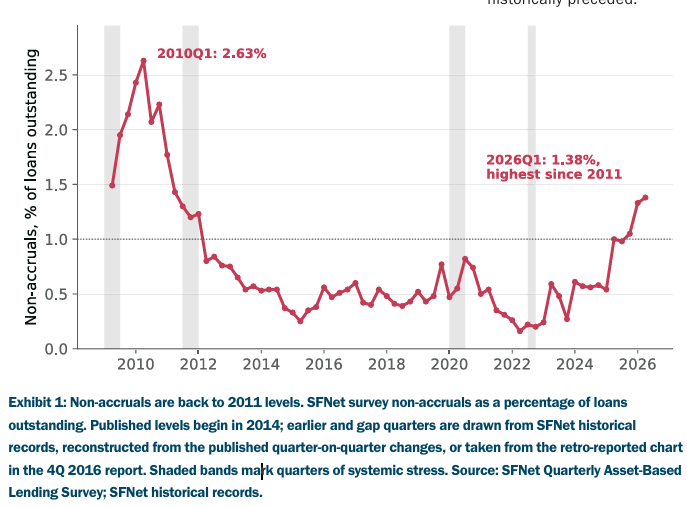
In the first quarter of 2025, non-accruals reported by SFNet members jumped from 0.54% of loans outstanding to 1.00%. They have stayed above one percent since, reaching 1.33% in the fourth quarter and 1.38% in the first quarter of 2026. That is the highest reading since early 2011, and roughly halfway back to the crisis-era peak of about 2.6%, reached in early 2010 (reconstructed from SFNet’s published quarter-on-quarter changes).
Now look at the market for comparison. Spreads on equipment and dealer-floor plan securitizations remain tight. New issuance is healthy. There has been no headline event. The two pictures are hard to reconcile, and the argument of this article, drawn from a working paper written with April Goulding of Bayes Business School,¹ is that this is not a puzzle. It is what the historical record says usually happens: the survey moves first.
What the Survey is Saying Now
Three features of the current data stand out.
The level is back to where it last was in 2011. Non-accruals spent 2022 near 0.2% of loans outstanding, the most benign stretch in the published record. They have climbed almost continuously since, and the recent moves have not been gradual: the rate nearly doubled in a single quarter at the start of the year, jumped again at the end, from 1.05% to 1.33% in the fourth quarter, and the first quarter of 2026 has extended the run to 1.38%. (Exhibit 1).
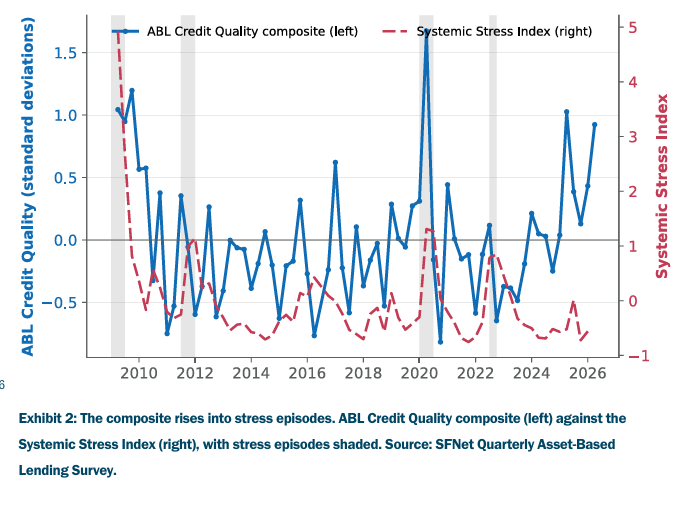
The composite moved with it. The research uses a single index, ABL Credit Quality, built from five reported flows: the quarter-on-quarter change in non-accruals, the share of lenders reporting rising non-accruals, the change in line utilization, commitment growth, and the diffusion of write-off increases. In the first quarter of 2025 that index reached one standard deviation above its long-run average, its highest since the pandemic quarter of 2020; it eased over the middle of the year, turned up again into the fourth quarter, and by the first quarter of 2026 it was back near that level. Nearly half of responding lenders (46%) reported rising non-accruals in that quarter, up from 24% the quarter before.
Utilization is firming again. Line utilization moved back to roughly 40% by mid-2025, having drifted down from 42% at the start of 2023 to 36% by the end of 2024, before easing to 37% in the fourth quarter; in the first quarter of 2026 it snapped back to 39% as borrowers drew more heavily on existing facilities. Borrowers drawing more on their lines while credit quality softens is a combination familiar to anyone who has managed a book through a turn.
None of this says a crisis is imminent. Levels in this range remain manageable, and the industry has absorbed comparable readings before without systemic damage. What the research adds is a different question: not whether these levels are alarming in themselves, but what they have historically preceded.
Why the Survey is Early
The reason is the lending model, and it is worth stating plainly because it is often mistaken for something else.
An asset-based facility is monitored continuously. The lender holds cash dominion over the borrower’s accounts. The borrowing base is recalculated as receivables and inventory move, and it is tested against the borrower’s actual working-capital position rather than a projection made at closing. Field examinations and appraisals happen on a schedule, not on an event. When a borrower’s collateral quality starts to slip, the lender sees it in the borrowing base before it appears anywhere else, because the borrowing base is the instrument through which the relationship is conducted.
Securities markets have no equivalent vantage point. A bond investor sees the collateral only through periodic reports, and only after the fact. That is a structural feature of the instrument, not a failing of the investor.
Those observations are what the survey collects: SFNet’s members supply the figures to their trade association, and the association publishes them. What the survey does is aggregate, quarter by quarter, a view of borrower condition that exists only because someone is monitoring the collateral continuously. The advantage is one of vantage point and of process, not of secrecy, and the whole point of publishing the survey is that the vantage point becomes available to everyone who reads it.
What the Research Finds
The paper takes 17 years of quarterly SFNet observations, combines them with a standard set of macro-financial controls, and asks whether the survey improves the prediction of system-wide financial stress out of sample, using only information that would have been available at the time of the forecast.
It does. Adding a parsimonious block of ABL survey indicators to standard macro-financial controls raises 12-month-ahead prediction accuracy, measured by AUROC, from 0.67 to 0.73. On the standard scale, 0.5 is a coin flip and anything above 0.7 is considered genuinely useful; a six-point gain of this kind is meaningful against the benchmarks in the early-warning literature.
The comparison with market data is the sharpest way to see what the survey contributes. Take the standard macro-financial model, which reaches 0.67 at the twelve-month horizon, and give it one more input. Add the survey indicators and it rises to 0.73. Add instead a measure of secondary-market prices for commercial asset-backed securities, the equipment and dealer-floorplan bonds whose collateral is closest to ABL’s. Built from trades reported through FINRA’s TRACE system and evaluated on the same quarters and the same horizon, it does not move the model: 0.66. On this test the SFNet survey beats TRACE outright: the survey earns its place alongside standard indicators and the traded price does not.
Run the two against each other and the picture is consistent but narrower. A survey-only model and a prices-only model finish level at 12 months, both 0.70, and the survey beats prices at two years, 0.86 against 0.85. That margin is slim but still worth stating plainly. The robust result is not that the survey wins a race against prices; it is that the survey carries information about borrower condition that prices do not contain at all.
The result is strongest at long horizons. Asked whether system-wide stress will occur at any point in the next two years, the full model reaches 0.868. The survey’s advantage is not that it reacts faster to today’s news; it is that it sees conditions markets have not yet had reason to price.
Exhibit 2 shows why. It plots the ABL Credit Quality composite against a systemic stress index built from market-wide indicators, with stress episodes shaded. The composite rises into the 2009 and 2011 episodes, into the pandemic quarter of 2020, and into the 2022 tightening. It is rising again now.
The Supervisors are Seeing the Same Divergence
An independent check comes from the regulators. The interagency Shared National Credit review, in which the Federal Reserve, the FDIC and the OCC examine every syndicated credit above $100 million shared by three or more supervised institutions, reported for 2025 that overall criticized levels were roughly flat at 8.6% of $6.9 trillion in commitments. Non-accrual commitments, however, rose 30.4% in a single year, from $65.1 billion to $84.9 billion.
That is the same shape as the survey’s message: the headline measures look calm, the harder credit measures are accelerating. The OCC’s Fall 2025 Semiannual Risk Perspective likewise records that commercial and retail delinquencies, loss rates and classified levels “remain manageable,” which is true of levels and is precisely why the direction of travel matters more than the level right now.
Over the 17 years the two series overlap, the ABL Credit Quality composite has tended to turn before the supervisory criticized rate rather than after it.
What to Watch
Watch the composite, not only the level. A non-accrual rate of one percent is not, by itself, a warning. A non-accrual rate that has doubled in a quarter, alongside firming utilization and a broadening share of lenders reporting increases, is a different signal. The research finds the predictive content sits in the combination and in the flows, not in any single level.
Watch the gap between headline calm and credit measures. In both the supervisory data and the market data, the aggregate picture is currently more reassuring than the underlying credit measures. Historically, that gap has closed in one direction more often than the other.
Keep responding to the survey. This is the practical point, and it is not a courtesy. The predictive content documented here exists because a large share of the industry reports consistently, quarter after quarter, including the roughly 40 percent of the market that is non-syndicated and therefore appears in no public filing anywhere. There is no other source for that segment. Every complete response makes the indicator sharper, and the case now being made to academics and policymakers, that secured lenders’ assessments deserve a place in how systemic risk is monitored, rests on the completeness of that record.
The Bottom Line
The numbers SFNet members report each quarter are not a lagging administrative return. On 17 years of evidence they are a leading indicator of system-wide financial stress, and they carry information the traded market does not. That is a function of how asset-based lending works: continuous monitoring of collateral produces a view of borrower condition that no secondary-market investor can assemble from the outside.
Those numbers are now at their highest since 2011, and they are rising while spreads stay quiet. The industry has the earliest view of this cycle that anyone has. It is worth acting like it.
By the Numbers
1.38%: SFNet survey non-accruals, 2026Q1, the highest since early 2011
0.54% to 1.00%: the move in a single quarter, 2024Q4 to 2025Q1
0.67 to 0.73: accuracy of twelve-month-ahead crisis prediction, before and after adding the ABL survey indicators
0.86 against 0.85: two-year-ahead prediction accuracy, the survey ahead of secondary-market prices
0.868: two-year-ahead prediction accuracy once the survey is added to standard indicators
68 quarters of survey data, 2009 to 2026
¹ Ding, H., and A. Goulding, “Asset-Based Lending as a Leading Indicator of Systemic Crises,” working paper, available at ssrn.com/abstract=6954858. The paper has been presented at the Bank of Finland and European Systemic Risk Board joint conference and the International Risk Management Conference.
To read this article as it appears published in the September/October issue of The Secured Lender magazine, please click here.
About the Author




© 2026 Secured Finance Network

