- Pasadena Private Lending and Eagle Point Credit Management Announce $105 Million Strategic Capital Partnership
- SFNet Releases its Latest Market Pulse Report
- SFNet Creates the SFNet Guide to the New York Commercial Finance Disclosure Laws and Regulations
- Forging the Future of Secured Finance: Highlights from SFNet’s 8th Emerging Leaders Summit
- Gordon Brothers Expands Capital Base to Over $1 Billion with New CPP Investments Financing
SFNet Q2 2020 Asset-Based Lending Index
September 15, 2020
By: SFNet Data Committee
The Pandemic
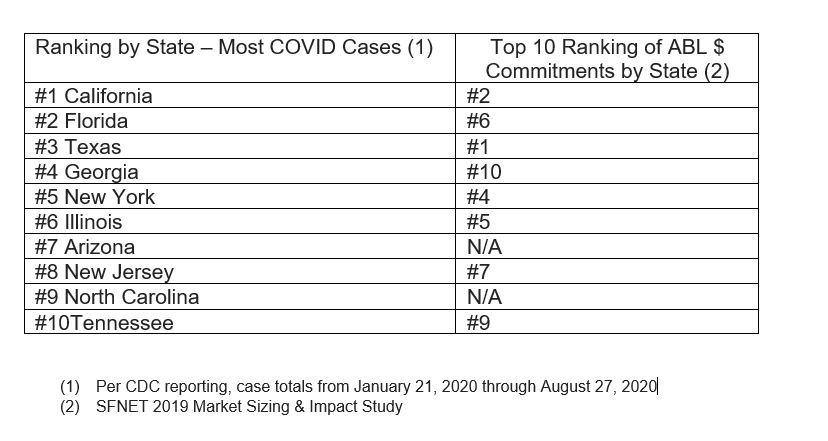
The first laboratory-confirmed case of COVID-19 in the United States occurred on January 20, 2020, and was reported to the CDC on January 22, 2020. By April 1, 2020 the United States was averaging 27k cases per day and the rate increased to 41k cases per day by June 30, 2020, peaking at 75k cases on July 24th. From a geographic perspective, the five states with the largest number of reported cases were CA, FL, TX, GA, and NY. According to the 2019 SFNET Market Sizing and Impact Study, these same states represent 5 of the 10 largest states in terms of ABL commitments:
 For certain, the pandemic impacted our country, most of our clients and all of us. The pandemic’s effect on ABL industry participants was noticeable. We saw dramatic shifts in the data set for Q2 2020. Some of the statistics were off the charts! In the following categories the information collected was the highest (or lowest) recorded quarter over the last 4.5 years:

Market Backdrop
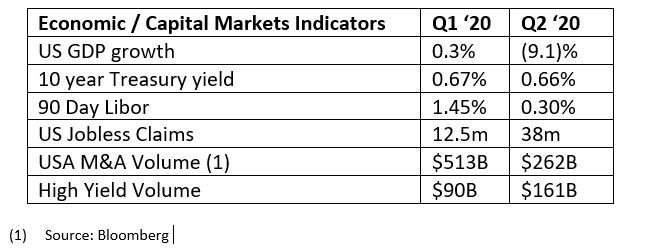
We consider the following data as we evaluate the Q2 ABL market:

Q2 Data Highlights
Confidence Index
Notwithstanding the economic collapse, significant loan runoff and deteriorating portfolio quality, the Bank Market and Non-Bank market participants feel considerably better about their prospects at the end of Q2 versus the end of Q1. On a combined basis, 9 of the 10 confidence indicators increased in Q2 for the Bank and Non-Bank participants. The responses could reflect the timing of the survey collection (April & July). Most of the country was shell-shocked during the beginning of the COVID lock-downs in March/April and by July perhaps we had become oriented to the ‘new normal’. Additionally, respondents feel more confident about their businesses because economic activity has stabilized (jobless claims bottoming out for example), the equity market has rallied and historically the ABL industry has generally experienced growth during recessionary environments.
Commitments and Outstandings
In Q2 the ABL Bank Market realized modest commitment increases but registered a whopping 24.1% decline in loan balances, reversing loans back to Q1 2018 levels. The significant decline in Q2 loan balances reflects economic deterioration (specifically lower revenue, working capital and investment activity for our clients), government stimulus, (cash available to our clients) and robust capital markets issuances which led to pay downs on revolvers. Furthermore we experienced paybacks in Q2 from some clients who had drawn down on their revolvers defensively during Q1. Many clients eventually realized that this crisis was different than 2008. Health of the banking sector was not of grave concern and many issuers began to feel comfortable repaying their defensive draws in Q2.
New commitments measured $6.7B in Q2 reflecting a higher level of ‘Fallen Angel’ activity, in particular in the Retail industry vertical. COVID was disruptive to most retailers and several accessed the ABL market in Q2 to obtain covenant lite financing. Publicly traded retailers such as Macy’s, the GAP and Kohl’s were among high profile retailers tapping the ABL market for financing in Q2. While new commitment activity was $6.7B, the level of loan balances associated with the commitments was modest. It’s possible that the Fallen Angel retailers will begin to borrow more as their stores re-open and they head into pre-Holiday inventory build season.
Utilization
In the Bank market, utilization declined to 38.3%. This level of utilization is the lowest since the figures have been collected over the last 4.5 years. The loan run-off reflects modest new loan commitments ($6.7B increase in Q2), lower economic activity, robust capital markets issuance and repayment of ‘defensive’ revolver draws which occurred at the outset of the pandemic. If utilization remains at these levels we will carefully watch market activity during the back-half of 2020 to evaluate lender behavior related to new business originations.
Credit Quality
Q2 witnessed soaring levels of non-accruing loans and criticized/special mention classifications. In Q2 non-accruals shot up to $616 Million, a 47% increase over Q2 2019. As a percentage of loans outstandings, non-accruals measured 82bps compared 49bps in Q2 2019. Similarly, the percentage of criticized and special mention loans rose 44% to $10.4B in Q2 2020 versus the same period a year ago. Criticized and special mention assets were 18.5% of total loans outstandings, the highest level on our 4.5 year data tracker.
Somewhat comforting is that gross write-offs measured only $55.6 Million in Q2 2020. This was an increase over Q1 2020 but in line with the historical peak in 2016 of ~ $57 Million. So while the economic impact of COVID was severe, and risk rating migration is occurring, it seems that ABL loan portfolios are ‘bending but not breaking’.
Non-Bank Market
Respondents are quite optimistic and expect strong demand for new business, portfolio performance to remain stable and business conditions to improve. Respondents likely foresee the economic dislocation creating more opportunities for Non-Bank lenders consistent with previous recessionary environments. Accordingly the outlook for hiring among Non-Bank lenders ticked up in Q2 of 2020 as lenders feel the need to staff accordingly for heightened business volume and to monitor the portfolio more closely.
In the Non-Bank market loan usage decreased 29.4% which reflects the aforementioned decline in economic activity causing lower revenue, working capital and investment. Additionally, clients in this market likely had access to the PPP loan program which helped bolster their liquidity during Q2 and some of those funds could have repaid revolver draws. The decline in loan outstandings to $1,012 Million mirrors the level recorded in Q2 2017. The abrupt decline erases the 3 previous years of trending loan growth.
New commitment growth in Q2 was down sharply compared to the last 6 quarters, measuring $124.6 Million. New commitment activity was muted for several reasons including the impact of COVID on borrowers and the inability to visit clients and conduct field exams & appraisals. The influx of PPP loans and other government loan programs, which were tapped by middle market borrowers, supplemented ABL financing as clients sought to sure up their balance sheets during early stages of COVID.
New outstandings grew by $54 Million in Q2, which was down significantly from Q1 and relatively low as compared to the 2 year trend line. Notably, while new commitment growth and new outstandings growth were modest in Q2, the level of loan runoff was generally in line with previous quarters. Unlike the Bank market where significant run-off was seen because Issuers had access to the equity and debt capital markets, such a dynamic dos not exist in the Non-Bank market.
In the Non-Bank market, $124 Million of new commitments was not enough to offset loan runoffs leading to a sharp (albeit less steep compared to the Bank market) decline in utilization down to 44.1% in Q2.
Conclusion
Q2 2020 goes down in the record books as perhaps the most volatile quarter witnessed since we’ve collected the statistics. We observed sizable shifts in utilization and the resettlement of portfolio ratings. In hindsight none of this seems surprising given the Black Swan nature of COVID.
If you seek encouragement, then consider the following:
1) While risk ratings and non-accruals migrated, the industry did not experience significant loan losses. The ABL product stood the test and endured (just like we knew it would).
2) The Confidence Index has improved in Q2 reflecting the fact that lenders are optimistic about the future prospects for business conditions and their lending opportunities.
The ABL market has performed well during previous recessions, acting as a safe harbor for Issuers without access to more traditional forms of bank financing. We saw significant Fallen Angel and restructuring opportunities in Q2 of 2020. Lenders are expecting these opportunities to continue and are also hopeful that with stable capital markets we will see a return of M&A activity which was muted during Q2.
We will continue to monitor future responses for clues to lender’s optimism and outlook. In the meantime stay safe and healthy!
If you find our industry analysis helpful, we strongly encourage you to participate in future surveys if you are not already doing so. We try to provide meaningful reporting but having participation from all of our lender members will ensure that we provide the best industry information possible.


